Upland Analytics Overview
Upland Analytics is a purpose-built analytics solution that helps large organizations visualize their data to make timely, data-driven decisions about their business.
Upland Analytics allows you to create insightful dashboards and reports that allow the discovery of hidden insights in your data easily. Report builders can design a host of pixel-perfect reports, Bar Graphs, Stacked-Bar Graphs, Line Graphs, Pie Graphs, Radial Gauge graphs, Scatter Graphs, Bubble Graphs, Motion Graphs, Heat Maps, Area Graphs and Radar Graphs with drag and drop ease.
While the articles on this site will provide information on Upland Analytics in the context of Eclipse PPM, the Upland Analytics Help Center offers a more comprehensive guide on designing the various reports and dashboards adapted to your needs.
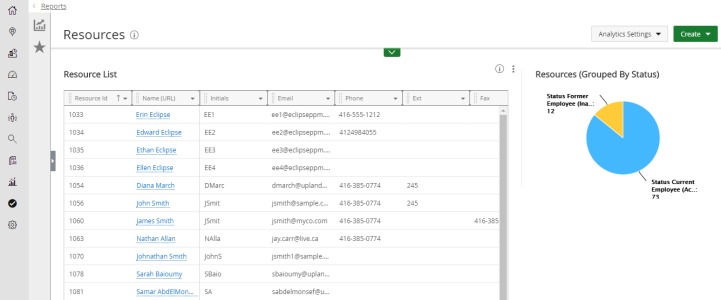
Fully integrated into Eclipse PPM, Upland Analytics provides easy-to-use, interactive dashboards and reports to deliver automated and accurate real-time performance monitoring with actionable insights that can be shared across the organization. Project Managers to Executives can monitor trends, identify risks, and make timely decisions for the business.